Home > Form Entry Analytics
Form Entry Analytics
ARForms facilitates you to display entries ratio in form of analytics. This functionality is displays analytics of all forms or specified form.
You can view entries ratio by three ways:
1) Daily
2) Monthly
3) Yearly
By clicking any of this tab, you can view analytics according to the selected option.
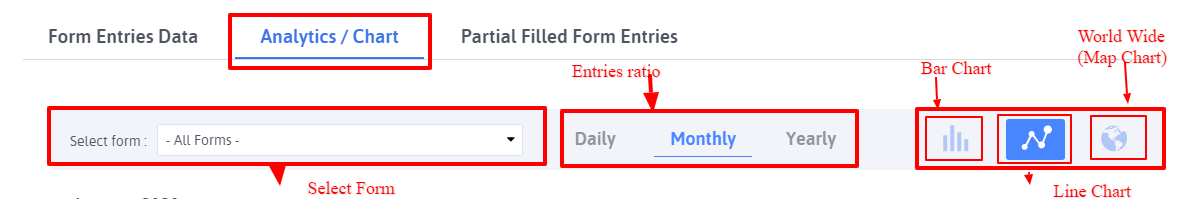
Apart from these ARForms gives you three different Graphical/Statistics Representation namely :
1.Bar Chart.
Bar chart is a graphical presentation of views and entries with rectangular bars with heights or lengths proportional to the values that they represent.This is used to show comparisons among views and entries.
Here you will see two different rectangular bar that represents Entries & view separately.

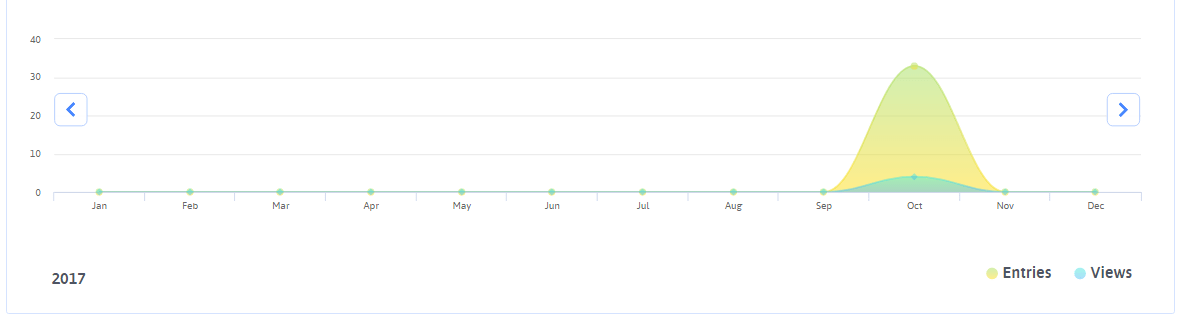
2.Line Chart.
Line Chart is graphical representation which displays views and entries as a series of data points called ‘markers’ connected by straight line segments.
This is used to visualize a trend in views and entries over intervals of time.
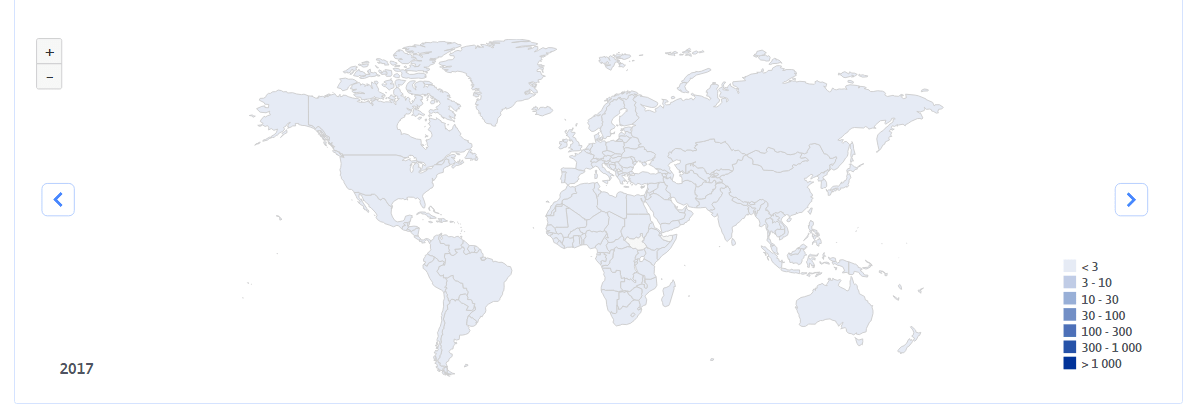
3.World Wide Entries & Views.
It is also referred as map chart, this illustrates the relative views & entries of the selected form in different countries of the world.
- Building a Form
- Multicolumn & Resizable
- Input Field Types
- Other Field Types
- Running Total ( Math Logic )
- Repeater (Add More)
- Conditional Logic
- Multi-Parts / Multi Pages Form
- Page Break Timer
- Email Notification
- Form Submit Action
- Custom Webhook URL
- Form Styling Options
- Opt-ins : Integrate Email Marketing Tools
- Form Other Options
- External database connection
- Convert Field Type
- Pre Populated Forms
- Auto save form Progress
- Don’t store entry in database
- Spam Protected Forms
- Pre Populated Popup Forms
- Pre Populated Userdata
- Populate Field values in html
- Dynamic Dropdown Options
- AddOns
- Authorize.net
- Signature
- PayPal
- Paypal Pro
- Stripe
- Active Campaign
- Digital Download
- Keap
- Mailster
- PDF Creator
- Post Creator
- SMS
- User Signup
- Google reCaptcha
- Zapier
- Google Spreadsheet
- Mailchimp
- Mollie
- Front End Entries View
- Cloud Storage
- Razorpay
- Payfast
- PagSeguro
- Zoho CRM
- Address Lookup Service Integration
- Omnisend
- Pipedrive